November 2023 The Shift e-newsletter
Alternative Proteins Webinar | Data as Cultural Artifact | Visualizing LCA Results | Upcoming Training
Free Webinar
Surveying the Environmental Impact of Alternative Proteins via Life Cycle Assessment
DATE: December 7, 2023
TIME: 1-2pm ET
PRESENTER: Nikhita Mansukhani Kogar
Senior Lead Scientist, The Good Food Institute
DESCRIPTION:
Alternative proteins are a powerful tool to mitigate the environmental impact of our food system, decrease the risk of zoonotic disease, and ultimately feed more people with fewer resources. However, a clear understanding of the environmental impacts of alternative proteins is essential to inform the suite of strategies available to make the transition to alternative proteins economically and environmentally sound. In this session with The Good Food Institute, Dr. Nikhita Kogar will provide an overview of modern plant-based meat production and review the highest environmental impact factors based on life cycle assessments conducted to date. An examination of these factors across the production process will follow, along with a discussion of the challenges and opportunities that the sector faces as a result.
PRESENTER BIO:
Nikhita Mansukhani Kogar is a Senior Lead Scientist for the plant-based pillar at The Good Food Institute. Prior to joining GFI, she worked in food and biotechnology product development, most recently as an Innovation Scientist at Beyond Meat. She holds a bachelor’s degree in physics from the University of Illinois at Urbana-Champaign and a Ph.D. in materials science and engineering from Northwestern University.
Data is a Cultural Artifact
Reflections on the EPIC conference by John Rooks, ESG Senior Research & Culture Advisor
I was lucky enough to be part of a panel at this year’s EPIC conference. EPIC brings people together who are unified by an ethnographic approach to innovation that is anchored in deep understandings of culture and human behavior. My panel, A Critical Moment for Global Change: Doing Ethnography and Sustainability,was selected to explore how an ethnographic approach to research can support sustainability efforts. For my part, I was talking about corporate (as opposed to academic) ethnographic opportunities in sustainability. From this corporate perspective, ethnographic research, and applying a cultural lens in general, are emerging strategies to advance sustainability.
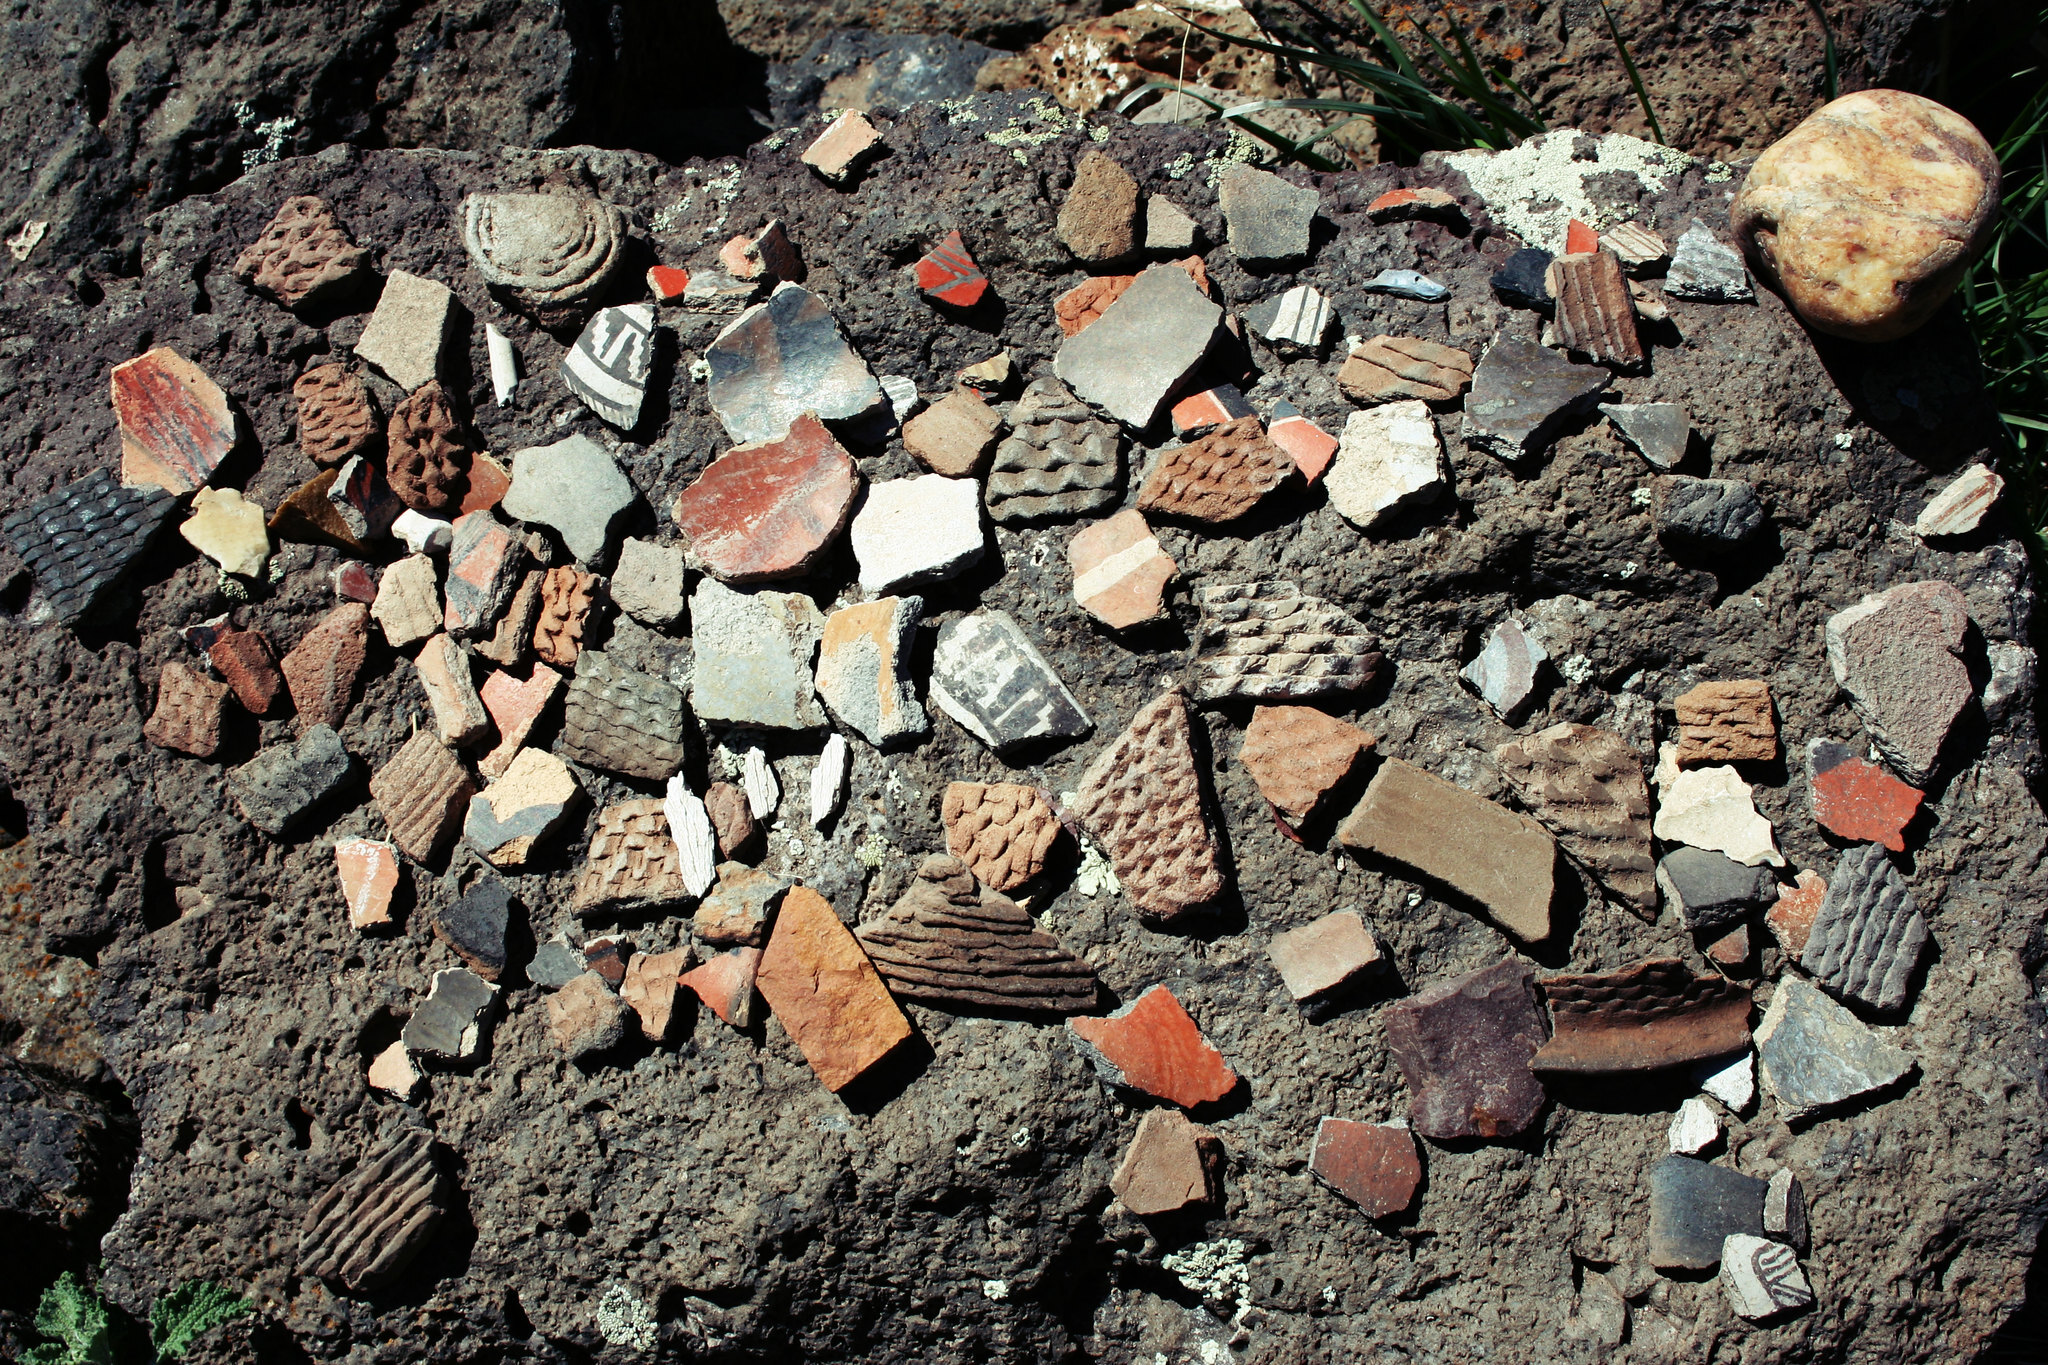
Think of how an archeologist or anthropologist look at a shard of pottery found layers down in the earth. They use these found artifacts, tools, pots, utensils, and funeral urns to better understand food preferences, cooking technology advancement dates, family unit roles and relationships, health indicators, mortality rates, art appreciation, and even gods. A fractured piece of pottery is a clue, an indicator of culture in the eyes of the anthropologist. To an LCA practitioner, data is a cultural artifact. It’s a clue to better understand a company’s relationship with science-based sustainability and humankind.
A company’s appreciation for and handling of data can tell us a tremendous amount about their culture. This relationship is a predictor of success in reaching their sustainability goals. Deeper than that, which of the 5 values of data they prioritize can tell us even more. Traditionally data is understood by 5 Vs: Velocity, Volume, Value, Variety and Veracity. Does a company value the speed at which they can collect and analyze data over accuracy? Volume over Variety? Is it handled with care, scrubbed for anomalies? Are their data models reviewed by third parties for Veracity? Do they share their impact data with competitors to consume, or is it locked in a vault and tagged as “proprietary” as we often find in our research on open-sourcing sustainability?
From Numbers to Insights: The Power of Data Visualization in Life Cycle Assessment
An interview with Tess Konnovitch, ESG Data Visualization Specialist
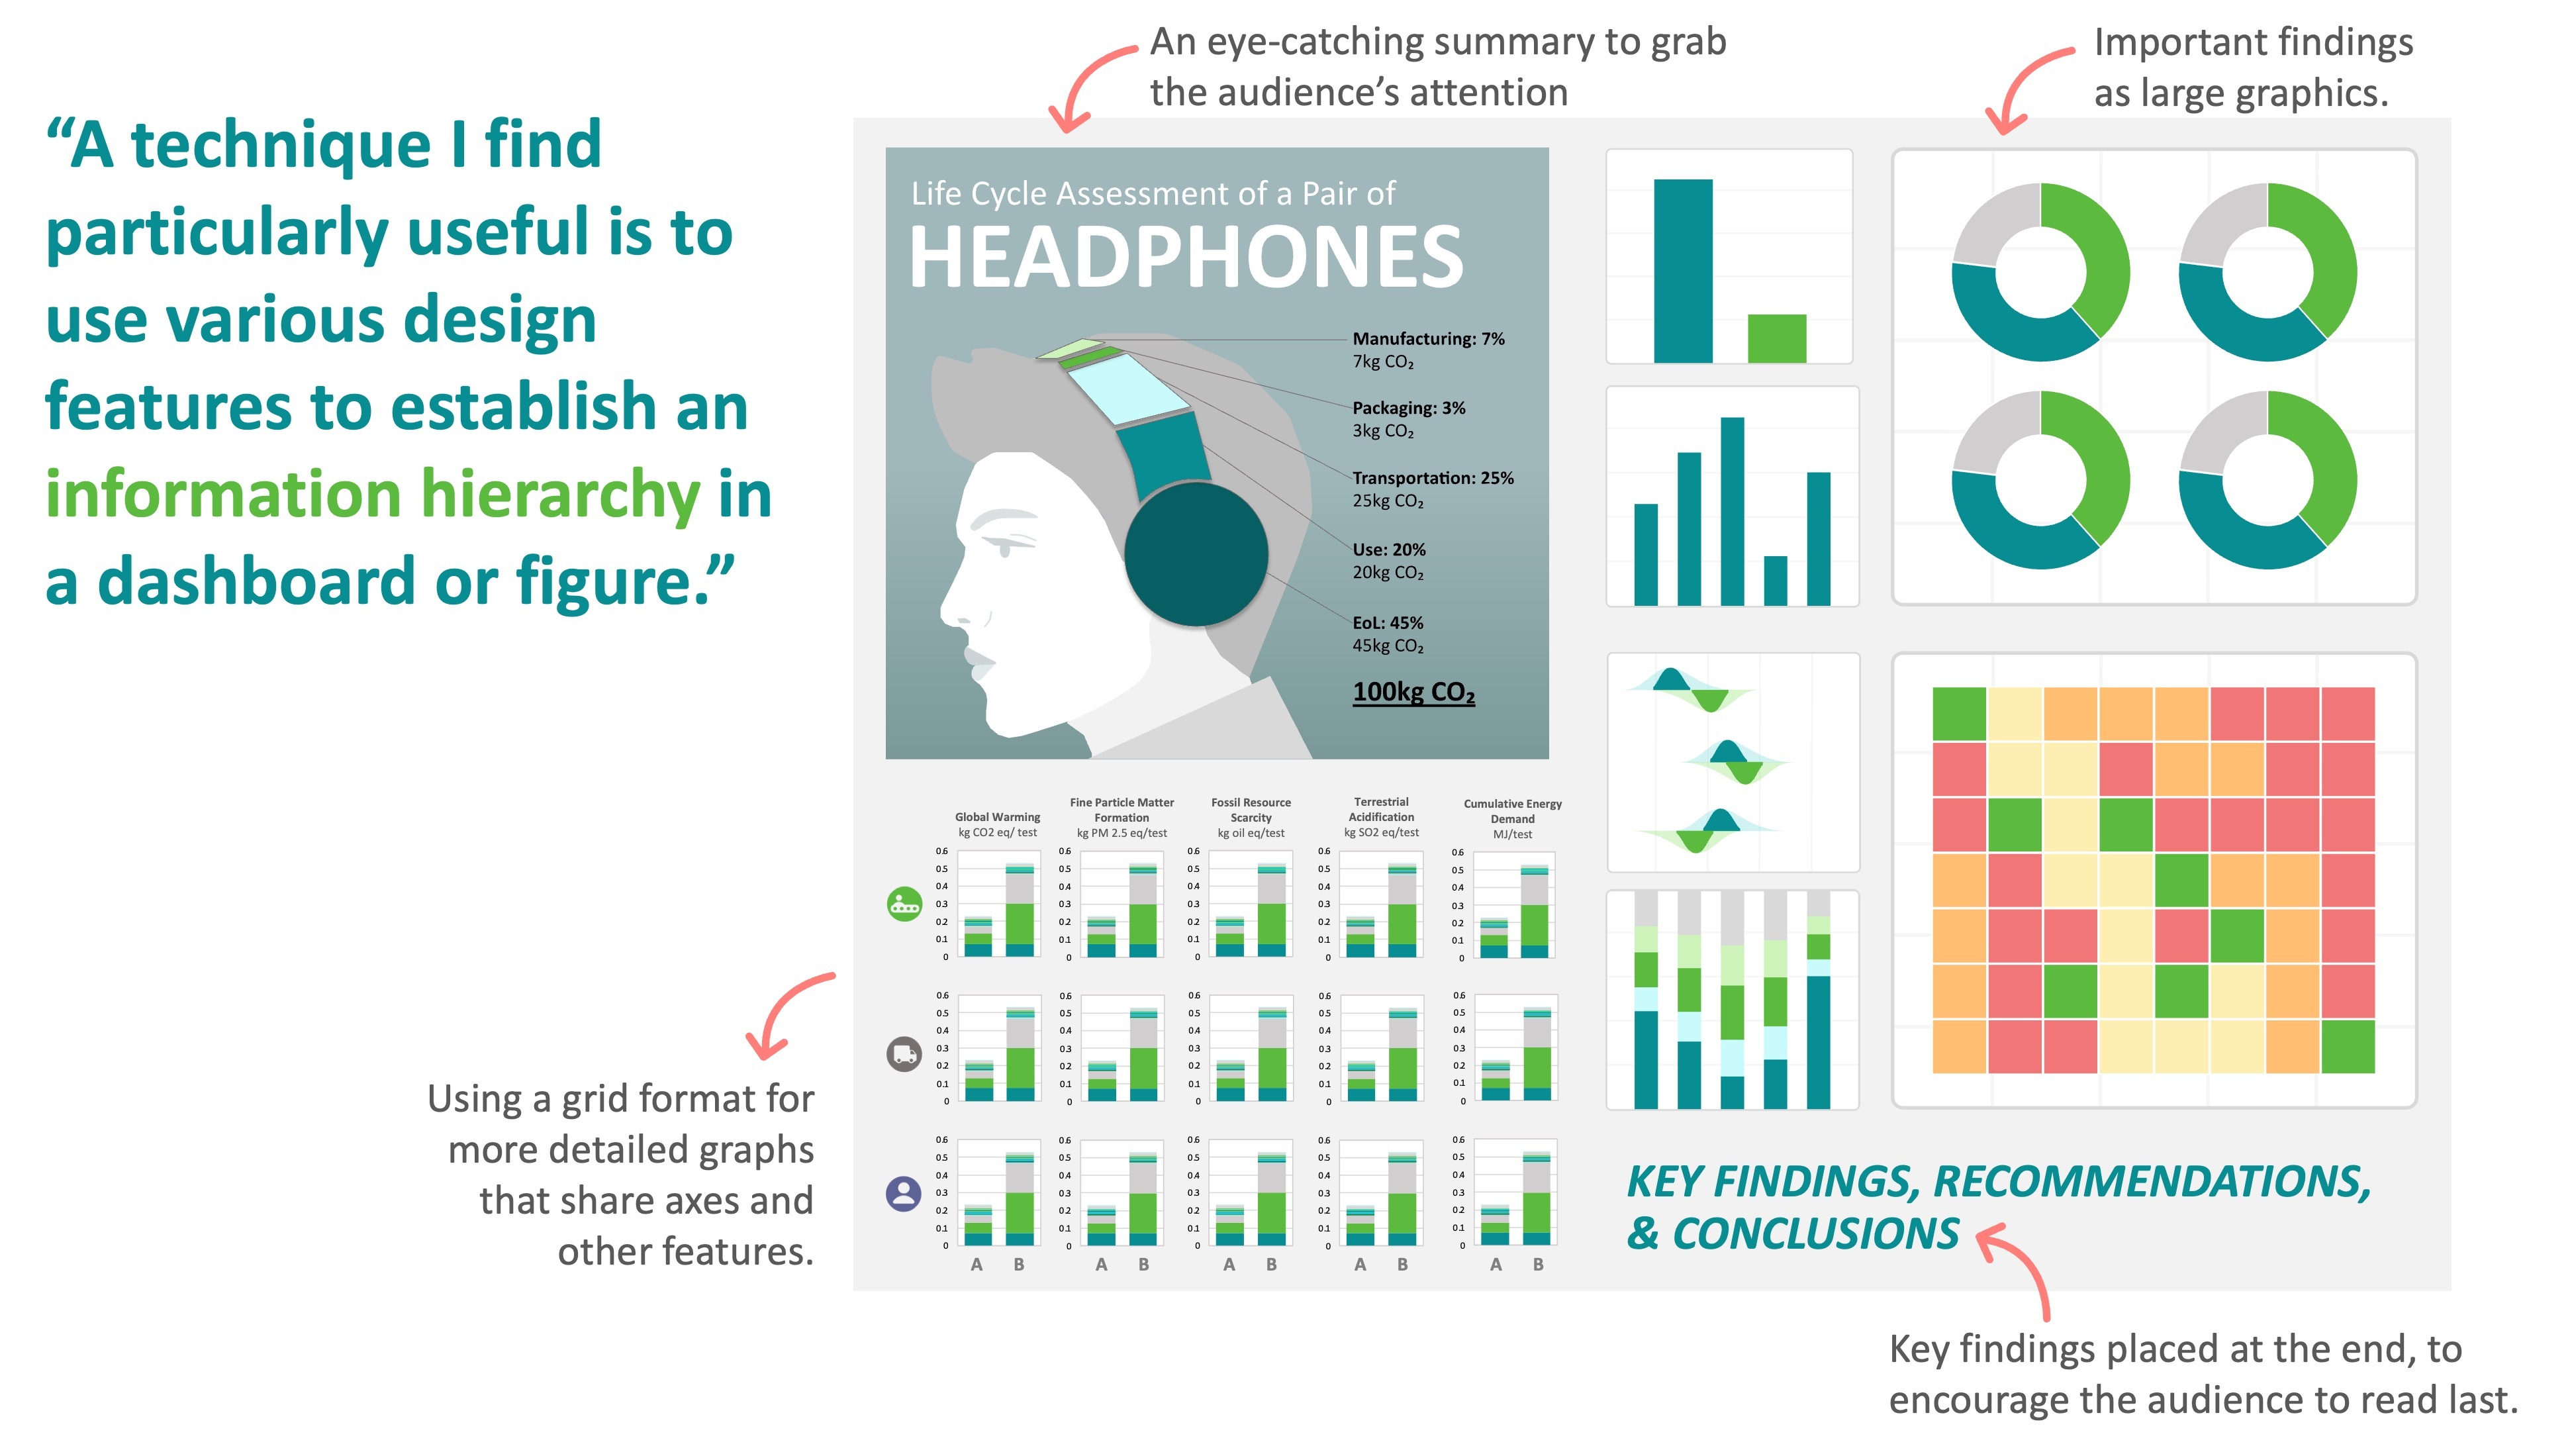
Life cycle assessment (LCA) is a crucial tool for evaluating the environmental impacts of a product or process. This comprehensive method, which considers the entire life cycle of a product from its raw material extraction to its disposal, often generates a large dataset that can be complex and difficult to interpret. That's where data visualization comes in.
We asked EarthShift Global (ESG) Data Visualization Specialist, Tess Konnovitch, about her experience visualizing LCA data. She has worked on a wide variety of projects, featuring multiple clients across differing industries and strongly believes data visualization is a critical bridge between the scientific, business-oriented, and public parties interested in our work, and sustainability in general.
Q: What is data visualization and how does it contribute to understanding LCA results?
Data visualization is the graphical representation of data and information. As a data visualization specialist, I help our analysts communicate complex information in a clear and concise manner to a wide variety of audiences. In general, data visualization is important for two primary reasons: it deepens the understanding of data for those involved, and it makes data accessible to those not involved. For those generating and working with the data, visualizations help to identify trends, patterns, and outliers that might not be evident in raw numbers. For those not working closely with the data, or those with little to no experience in math or science, visuals make that data more accessible and memorable, thus enhancing communication and understanding.
Upcoming Online Training
Social Impact Assessment - Sustainability ROI
November 8-9, 2023
Methods of Evaluating the Social and Economic Pillars of Sustainability
November 30, 2023
Sustainability in Package Design
December 5-6, 2023
Advanced Life Cycle Assessment - Anticipatory LCA
January 9-10, 2024