February 2024 The Shift e-newsletter
Communicating LCA Webinar | Leveraging LCA | Data Visualization | Upcoming Training
Free Webinar:
Putting LCA into perspective:
Communicating LCA Results to Humans to support Decision Making
DATE: February 29, 2024
TIME: 11am-12pm ET
PRESENTER:
Pia Wiche, CEO & Founder, EcoEd
DESCRIPTION:
We'll share several techniques we regularly use to communicate results of LCAs for non-technical audiences. From the humble bar chart to the noble Dachshund.
PRESENTER BIO:
Pia has worked in LCA for 14 years in 3 continents. She's been in academia and the private sector supporting decision makers in governments, cities, businesses and organizations.
How to Leverage LCA: Three Case Studies

In addition to our leading life cycle assessment analysis, software, and training services, we provide expert support on best practices in the positioning and communication of LCA studies.
In this post, we share three emerging technology company case studies and explain how they leveraged their LCA in the attainment of key organizational objectives.
Case Study: Biofine Technology (Biofine)
Biofine has developed an advanced biofuel derived from lignocellulosic biomass, ethyl levulinate, that has potential application as a low-carbon heating fuel. The Biofine technology enables the economic production of 100% renewable chemicals and second-generation advanced biofuels from any cellulosic waste stream. Biofine’s biofuel can be substituted for conventional home heating oil with minor retrofitting of the oil furnace.
Because of the inherent carbon reduction benefit of its biofuel, Biofine is positioning its biofuel as a low carbon alternative to conventional home heating oil.
Biofine used the results of a critically reviewed LCA to secure capital to build a production facility and establish a distributor relationship with Sprague, a leading Maine based oil dealer.
Communicating LCA: Beyond the Bar Chart
By Tess Konnovitch, Earthshift Global Data Visualization Specialist
EarthShift Global’s Data Visualization Specialist Tess Konnovitch discusses the different types of chart styles that are commonly used for life cycle assessment data visualization.
Tess presented this information with colleague Gianni Guglielmi at the 2023 LCA Institute; they are currently working on a guidance document that shares the below information, along with survey results and research, to help progress data visualization in the LCA community.
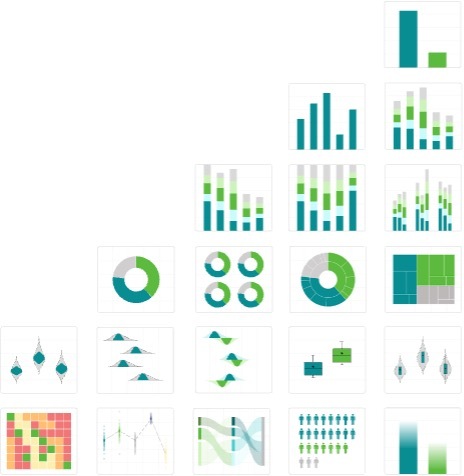
As a data visualization specialist, I work with analysts and clients to determine how to communicate their LCA data findings and insights. One of the most important decisions we make is determining which chart style will best convey the information. In this post, we will explore some of the most popular chart styles, their strengths and weaknesses, and when to use them for LCA data visualization. Effective visualization helps to more easily and accurately communicate LCA findings to a range of audiences.
The Bar Chart
To decide between a regular (vertical) bar chart and a stacked bar chart, consider if you want to compare the total values across categories or the individual values within each category. If you want to compare total values, a regular bar chart is the way to go, while a stacked bar chart is more appropriate if you want to show the composition of each category.
In terms of units, using actual values is best when the absolute values matter while using 100% values is useful when you want to show the relative proportions of each category. If you want to compare the values among categories that have vastly different scales, displaying data relative to the largest value can help provide a clearer picture of the relationships between categories.
In LCA results specifically, absolute values should only be used with one impact category. If you are including multiple impact categories, you must use relative values such as percentages or normalized values. Impact categories are not directly comparable. Excel will let you plot these categories, but that does not mean you should! Using absolute values to compare impact categories can be misleading and inaccurate, and it is important to use relative values and compare products or processes within the same category to get a more accurate picture of their environmental impact.
Upcoming Online Training
Sustainable Return on Investment 3 hour course
February 15, 2024
Organizational LCA 3 hour course
February 22, 2024
Handling Recycling in Life Cycle Assessment
March 27, 2024
Sustainability in Package Design
March 28-29, 2024